The MTA has been a source of ire and hatred for many commuters in New York. I can’t tell you how many times I have lost an entire afternoon due to a signal malfunction or a sick passenger. It isn’t widely known, however, that it wasn’t always a single, central authority controlling all the subways in New York. It used to be split into three major companies: the IRT (Interborough Rapid Transit), BMT (Brooklyn—Manhattan Transit) and IND (Independent Rapid Transit).
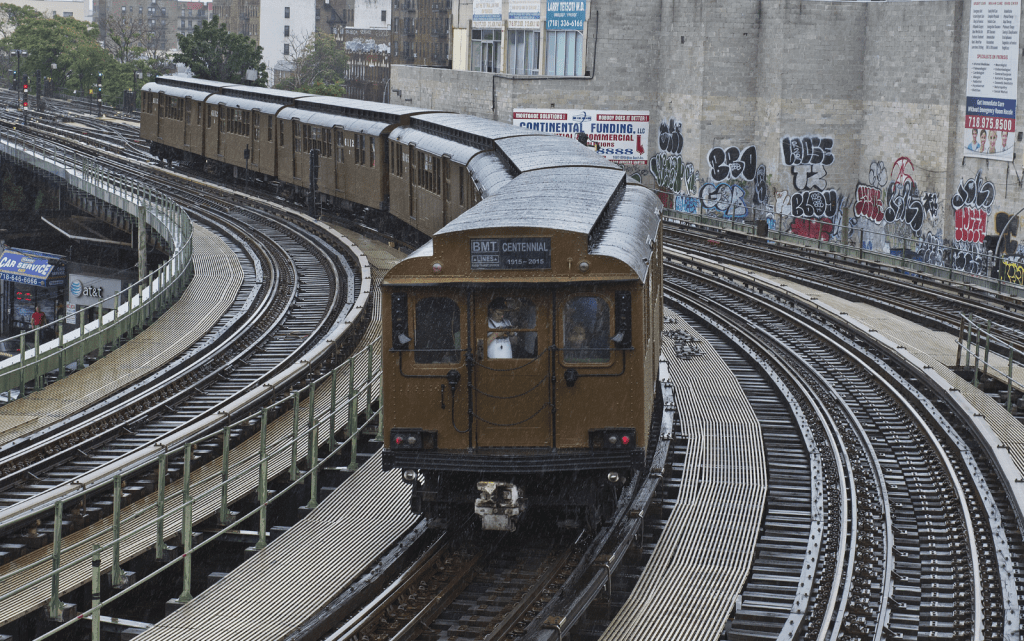
Unification didn’t come until 1940, when the city bought all three companies, setting the foundation (such as it is) for the modern New York subway system we all know and hate today. Now called “divisions” instead of separate companies or railroads, the IRT, BMT and IND still appear in categorizations of subway lines and stations. This classification is only necessary because the different companies had different standards for how long their train cars were and things like that.
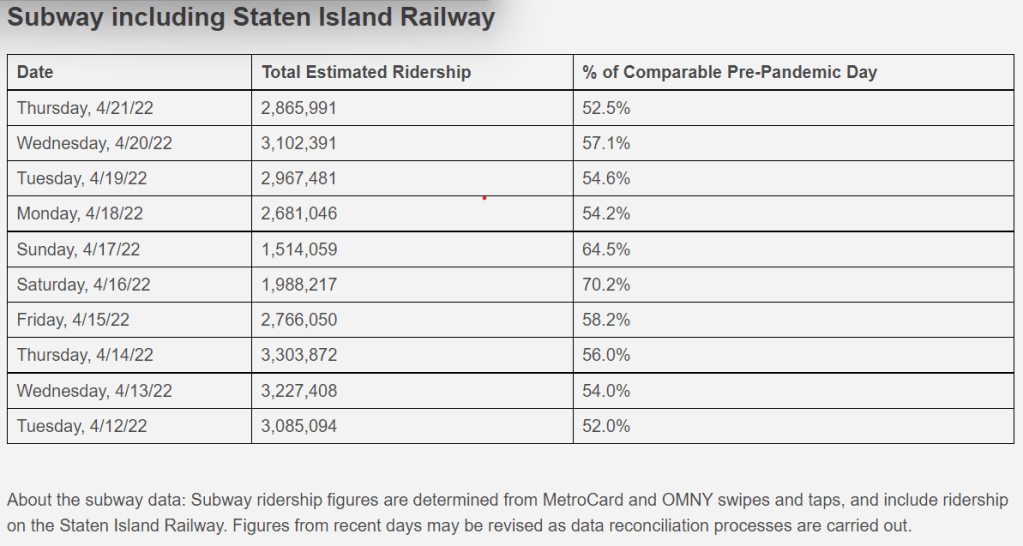
But what if that never happened, and the IRT, BMT and IND all still competed against each other? Who would have the highest revenue? The BMT, IRT, and IND focused on different parts of the New York area, so this could point to something interesting about the demographics of New York. This question is only made more interesting by the drop in ridership during the COVID pandemic. According to the MTA website, the subways are operating with about two thirds of the ridership from pre-pandemic days, it’s worth asking if all three divisions took this blow equally. Would the COVID-19 pandemic have changed the power dynamics between the competitors?
Because of the way the MTA tracks turnstile data, we can answer this question. In the files where the MTA stores their turnstile data, there’s a field called DIVISION. All we need to do is:
- Choose a period of time to analyze
- Count the number of times someone entered through a turnstile in the stations for each respective division (they keep track of that too in a field called ENTRIES).
- Multiply that number by 2.75, and that’s the total revenue in dollars.
I’m going to choose February through April of 2019, 2020 and 2021, respectively. This way, we can get a clear view of pre-COVID ridership, ridership DURING the COVID fall, and ridership deep in the heart of COVID, from the same time of year each year.
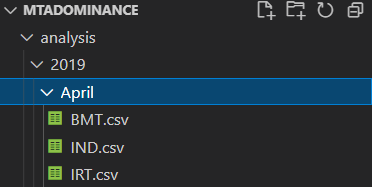
This is where things get time-consuming. To make things simpler and error-free, I’ve decided to split all the rows of the data files into directories for each month, and for each month giving each division its own file. The file tree has the structure YEAR/MONTH/[files]:
It takes 20 minutes to clean a single month of data! That’s THREE HOURS in all. I tried working out faster or more direct methods to do this, but none of them return numbers that could even dress up as correct on Halloween.
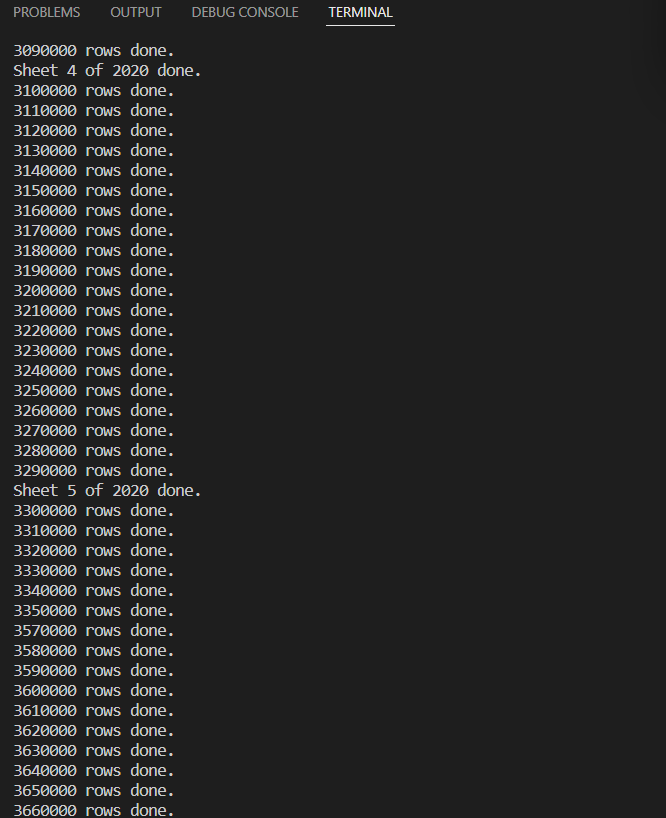
Overall, it ended up being more efficient to just wait through the data cleaning than to waste hours trying to write something faster.
Now to actually count the ENTRIES up. There’s a small trap here I almost fell into. Look at the numbers in the last two columns of this sample:
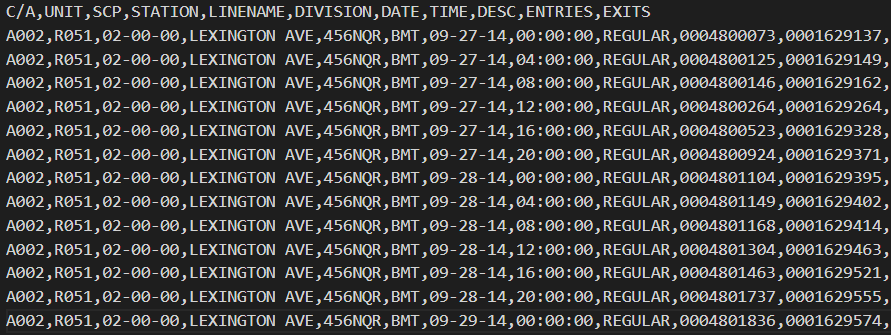
It‘s recording the amount of CUMULATIVE entries and exists, not the amount of NEW entries and exits. If I blindly add all these numbers up, I’ll get something orders of magnitude higher than the actual ridership numbers. So instead, I’m going to make the script count the difference between one line and the next to get the total INCREASE in the number of cumulative entries.
Alright, enough of the nerdy stuff, what’s the answer? During the 2019 period, the IRT earns the most revenue out of all three companies, with the IND in close pursuit, and the BMT trailing far behind.

The approximate ratio between the IRT, IND and BMT revenues respectively is 2:2:1, though the IRT is consistently the highest. Here’s what it looked like for 2020:
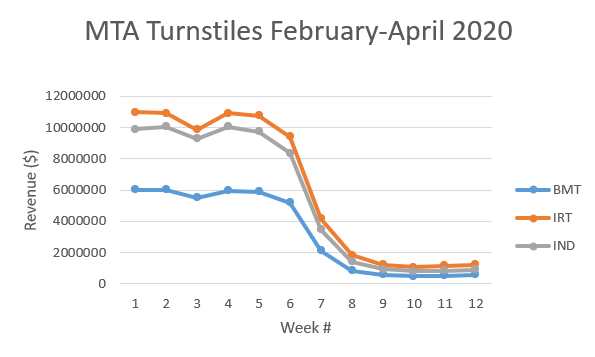
Pretty dramatic. As you can see, the ranking of the three companies remains unchanged. Now for 2021:
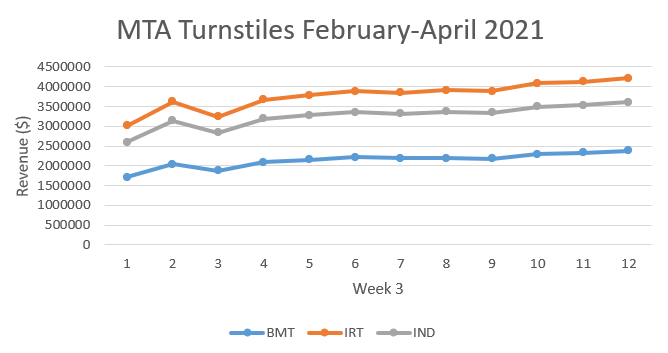
If you look at the axes on the side, the numbers are about a third of what they were pre-pandemic, which matches the MTA ridership estimates for this time. The ranking of the companies remains unchanged, and there’s a slight steady climb.
As for the February dips, I’ve tried to make adjustments to account for missing data and I’ve found nothing. I don’t think I can call it an anomaly, it’s probably a mistake I made somewhere. Regardless, it doesn’t take much away from the whole picture.
So there you have it! While it feels like COVID has changed everything forever, there is one hypothetical thing it wouldn’t change—the power relations between these companies and their profit margins. What’s wild is seeing how much less the BMT makes, I guess most subway traffic just goes through Manhattan (brilliant, who would’ve guessed?).
Thanks for reading!
